
Cosmic Data Visualization: Celestial Mechanics Mapping
Cosmic data visualization represents the cutting edge of how humanity perceives and interacts with the vastness of space. It transforms complex astronomical data into understandable and often beautiful graphical representations, allowing scientists, astrologers, and enthusiasts alike to grasp the intricate dance of celestial mechanics. This modern approach transcends traditional stargazing, offering dynamic insights into planetary movements, stellar evolution, and galactic structures, bridging the gap between raw scientific data and human comprehension.
The ability to visualize cosmic phenomena is not merely an aesthetic pursuit; it is a fundamental tool for discovery, education, and predictive analysis. From mapping the orbits of distant exoplanets to simulating the birth of stars, these visualizations provide invaluable perspectives. They empower us to explore beyond the physical confines of our planet, offering a deeper understanding of the universe's fundamental laws and their potential influence on our lives, as often explored in fields like astrology.
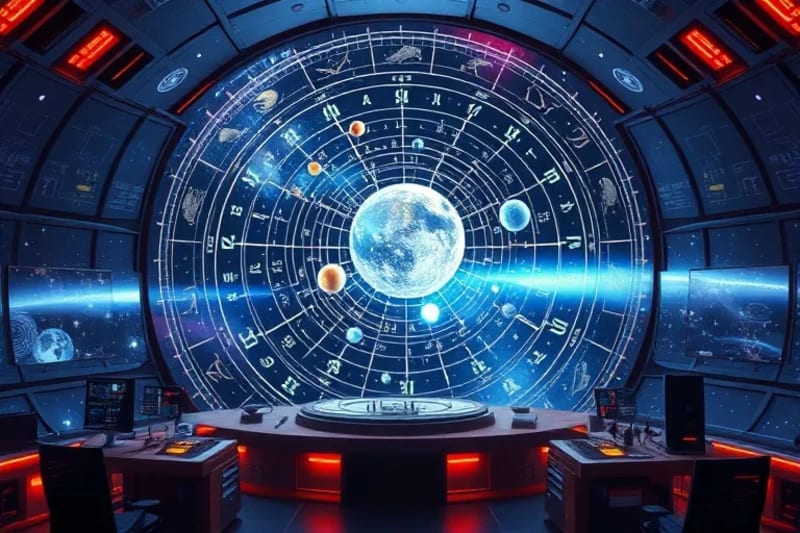
Modern observatories utilize advanced holographic displays to render complex cosmic data, illustrating the intricate movements of celestial bodies with unprecedented clarity.
This article delves into the fascinating world of cosmic data visualization, exploring its historical roots, technological advancements, and diverse applications. We will examine how modern technology, including artificial intelligence and virtual reality, is revolutionizing our ability to map and interpret celestial mechanics, offering new avenues for scientific research and astrological insights. Understanding these visualization techniques is crucial for anyone seeking to comprehend the cosmos in the 21st century.
Table of Contents
- Historical Perspective: From Stargazing to Digital Mapping
- The Evolution of Cosmic Data Collection
- Modern Cosmic Data Visualization Techniques
- Applications in Astrology and Celestial Mechanics
- Challenges and the Future of Cosmic Visualization
- Conclusion: Unveiling the Universe's Grand Design
Historical Perspective: From Stargazing to Digital Mapping
Humanity's fascination with the cosmos dates back millennia, with early civilizations meticulously observing celestial bodies to track time, predict seasons, and derive meaning. Ancient astronomers, from the Babylonians to the Mayans, developed sophisticated systems for mapping star charts and planetary movements, often using simple instruments like gnomons and armillary spheres. These early visualizations, though rudimentary by today's standards, laid the groundwork for celestial mechanics.
The Renaissance brought about a scientific revolution, with figures like Copernicus, Kepler, and Galileo transforming our understanding of the solar system. Kepler's laws of planetary motion, for instance, were derived from painstaking observations and mathematical calculations, effectively visualizing orbits long before computers existed. These intellectual leaps were often accompanied by hand-drawn charts and models, which served as the primary means of cosmic data visualization for centuries.
The invention of the telescope significantly expanded our observational capabilities, revealing previously unseen details of planets, moons, and distant stars. As data accumulated, the challenge of organizing and interpreting it grew. Early 20th-century astronomers continued to rely on photographic plates and manual analysis, a laborious process that underscored the need for more efficient visualization methods. The transition from analog to digital data collection marked a pivotal moment, paving the way for the sophisticated tools we use today.
The Evolution of Cosmic Data Collection
The modern era of cosmic data collection began in earnest with the space age. Satellites, space probes, and orbital telescopes like Hubble and James Webb have provided an unprecedented deluge of information across the electromagnetic spectrum. These instruments capture everything from visible light images to X-ray and infrared data, revealing aspects of the universe invisible to the human eye. The sheer volume and complexity of this data necessitate advanced processing and visualization techniques.
Ground-based observatories have also undergone a dramatic transformation. Arrays of radio telescopes, such as the Atacama Large Millimeter/submillimeter Array (ALMA), and gravitational wave detectors like LIGO, collect data that requires specialized algorithms to convert into interpretable forms. Each type of data—be it spectral, photometric, or astrometric—contributes to a holistic picture of cosmic phenomena, but only when effectively integrated and visualized.
The challenge lies not just in collecting data but in making sense of it. Petabytes of information stream in daily, detailing everything from the composition of planetary atmospheres to the dynamics of black holes. Without powerful visualization tools, this wealth of knowledge would remain largely inaccessible, buried in raw numbers and complex scientific notation. This evolution underscores the symbiotic relationship between data acquisition and its graphical representation.
Modern Cosmic Data Visualization Techniques
Today's cosmic data visualization employs a diverse array of sophisticated techniques, each designed to highlight different aspects of celestial mechanics and astronomical phenomena. These methods transform abstract datasets into intuitive and interactive experiences, making the universe more tangible.
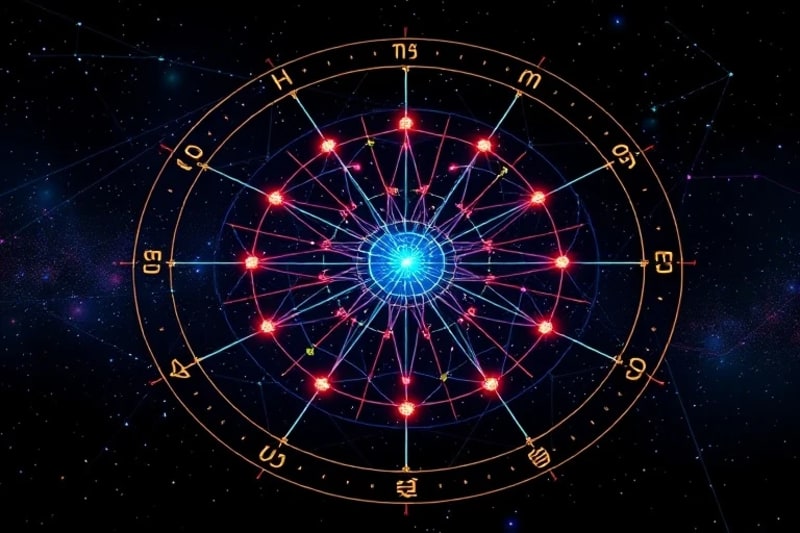
Vector art illustrates the digital interconnection of cosmic data, forming intricate constellations and orbital paths that symbolize advanced mapping technologies.
- Interactive 3D Models: These models allow users to navigate through simulated galaxies, zoom in on nebulae, and observe planetary orbits from any angle. Software like OpenSpace and WorldWide Telescope provide immersive experiences, letting users explore the universe as if they were physically present. These models are crucial for understanding complex spatial relationships and dynamic processes.
- Augmented Reality (AR) and Virtual Reality (VR): AR and VR technologies are revolutionizing how we interact with cosmic data. VR headsets can transport users into virtual spacecraft, allowing them to fly through asteroid fields or witness a supernova up close. AR applications overlay celestial information onto the real sky, enhancing stargazing with real-time data about stars, planets, and constellations. This immersive approach makes learning about celestial mechanics incredibly engaging.
- AI and Machine Learning: Artificial intelligence plays a critical role in processing and interpreting vast datasets. Machine learning algorithms can identify patterns in cosmic microwave background radiation, classify galaxies, or detect exoplanets with greater efficiency than human observers. AI-driven visualizations can highlight anomalies, predict future celestial events, and even generate synthetic data to fill gaps in observations.
- Data Sonification: Beyond visual representations, sonification converts cosmic data into audible signals. This technique allows researchers to "hear" the subtle variations in star brightness, the echoes of the Big Bang, or the gravitational waves from colliding black holes. It offers an alternative sensory pathway for data interpretation, particularly useful for identifying patterns that might be missed visually.
These techniques are not just for scientists; they are increasingly being used to educate the public and inspire a new generation of astronomers. The ability to dynamically explore the universe on a personal device or in a planetarium setting makes cosmic data accessible to everyone, fostering a deeper appreciation for the wonders of space.
Applications in Astrology and Celestial Mechanics
The advancements in cosmic data visualization have profound implications for both scientific celestial mechanics and the interpretive art of astrology. By providing accurate and dynamic representations of planetary positions and movements, these tools enhance our understanding across disciplines.
In celestial mechanics, visualization helps researchers model complex gravitational interactions, predict asteroid trajectories, and design space missions with greater precision. For instance, simulating the planets in the 7th house or any other house within a birth chart, allows for detailed analysis of their long-term effects. These visualizations are essential for verifying theoretical models and discovering new astrophysical phenomena.
For astrologers, cosmic data visualization offers unparalleled accuracy in generating birth charts and understanding planetary transits. Dynamic software can display the precise positions of planets, asteroids, and other celestial points at any given moment in time, offering a richer context for interpretation. This precision is vital for practices like electional astrology, where choosing the optimal time for an event relies on exact celestial alignments.
A 3D render depicting a glowing neural network superimposed on a nebula, symbolizing the intricate data processing and analysis involved in mapping cosmic phenomena.
Furthermore, these tools can help visualize complex astrological concepts such as elemental balance in a birth chart or the intricate dynamics of planetary aspects. By seeing these relationships graphically, astrologers can gain deeper insights into personality traits, life paths, and potential challenges. The ability to animate planetary movements over time also aids in understanding predictive astrology, showing how transits and progressions unfold.
The synergy between data visualization and astrological interpretation allows for a more informed and nuanced practice. It moves beyond static charts, offering a living, breathing model of the cosmos that reflects its continuous evolution and influence. This technological integration supports the ongoing exploration of how celestial mechanics might correlate with human experience.
Challenges and the Future of Cosmic Visualization
Despite the remarkable progress, cosmic data visualization faces several ongoing challenges. The sheer volume of data continues to grow exponentially, posing significant hurdles for storage, processing, and real-time rendering. Ensuring the accuracy and integrity of these visualizations is paramount, as even minor errors can lead to misinterpretations in scientific research or astrological readings.
Another challenge lies in making these sophisticated tools accessible and user-friendly for a broader audience. While professional software exists, there's a need for more intuitive interfaces that can be used by students, amateur astronomers, and the general public without extensive technical knowledge. The goal is to democratize access to cosmic knowledge, fostering widespread engagement with celestial mechanics.
The future of cosmic data visualization promises even more immersive and intelligent experiences. We can anticipate further integration of AI for predictive modeling and anomaly detection, allowing systems to highlight areas of interest automatically. Advancements in quantum computing may enable the processing of even larger datasets, leading to more detailed and accurate simulations of the universe. Imagine a future where every individual can virtually explore any corner of the cosmos from their living room, interacting with real-time data streams from distant probes.
The development of open-source platforms and collaborative projects will also be crucial, allowing a global community of scientists, developers, and enthusiasts to contribute to and refine these visualization tools. This collective effort will accelerate discovery and deepen our collective understanding of the universe's grand design. The potential for new insights into both scientific and esoteric aspects of celestial influence, like those explored in North Node South Node aspects, is immense.
Conclusion: Unveiling the Universe's Grand Design
Cosmic data visualization stands as a testament to human ingenuity, transforming the abstract complexities of celestial mechanics into tangible, interactive experiences. From the rudimentary star charts of ancient civilizations to the sophisticated 3D models and VR simulations of today, our ability to map and interpret the cosmos has evolved dramatically. This evolution is driven by relentless technological innovation, enabling us to process vast amounts of data from telescopes and probes across the globe and in orbit.
The impact of these visualization techniques extends far beyond scientific research, enriching fields like astrology by providing unparalleled accuracy and dynamic insights into planetary influences. As we continue to push the boundaries of what's possible, the future promises even more immersive and intelligent ways to explore the universe. Cosmic data visualization is not just about seeing the stars; it's about understanding our place within the intricate, ever-unfolding tapestry of the cosmos, fostering a deeper connection to the universal energies that shape our existence.
Source: Hybrid content assisted by AI and human editorial supervision.


Comments
Post a Comment